Platform · Exit scenarios
What do we get if our portfolio company sells?
Input an exit value or a metric multiple for any company in your portfolio and see how the exit waterfall flows to each fund and holder, by share class, straight from the financing documents, the charter's preference stack and the cap table. The scenario a partner ran in September informs the one the auditor sees in January.
Included in every plan, for every company in your book, whichever tool its cap table lives in. Your first waterfalls the day the documents land, and every partner gets a login that day. Excel export keeps the formulas live.
The documents behind the answer
The truth in private capital is in the documents.
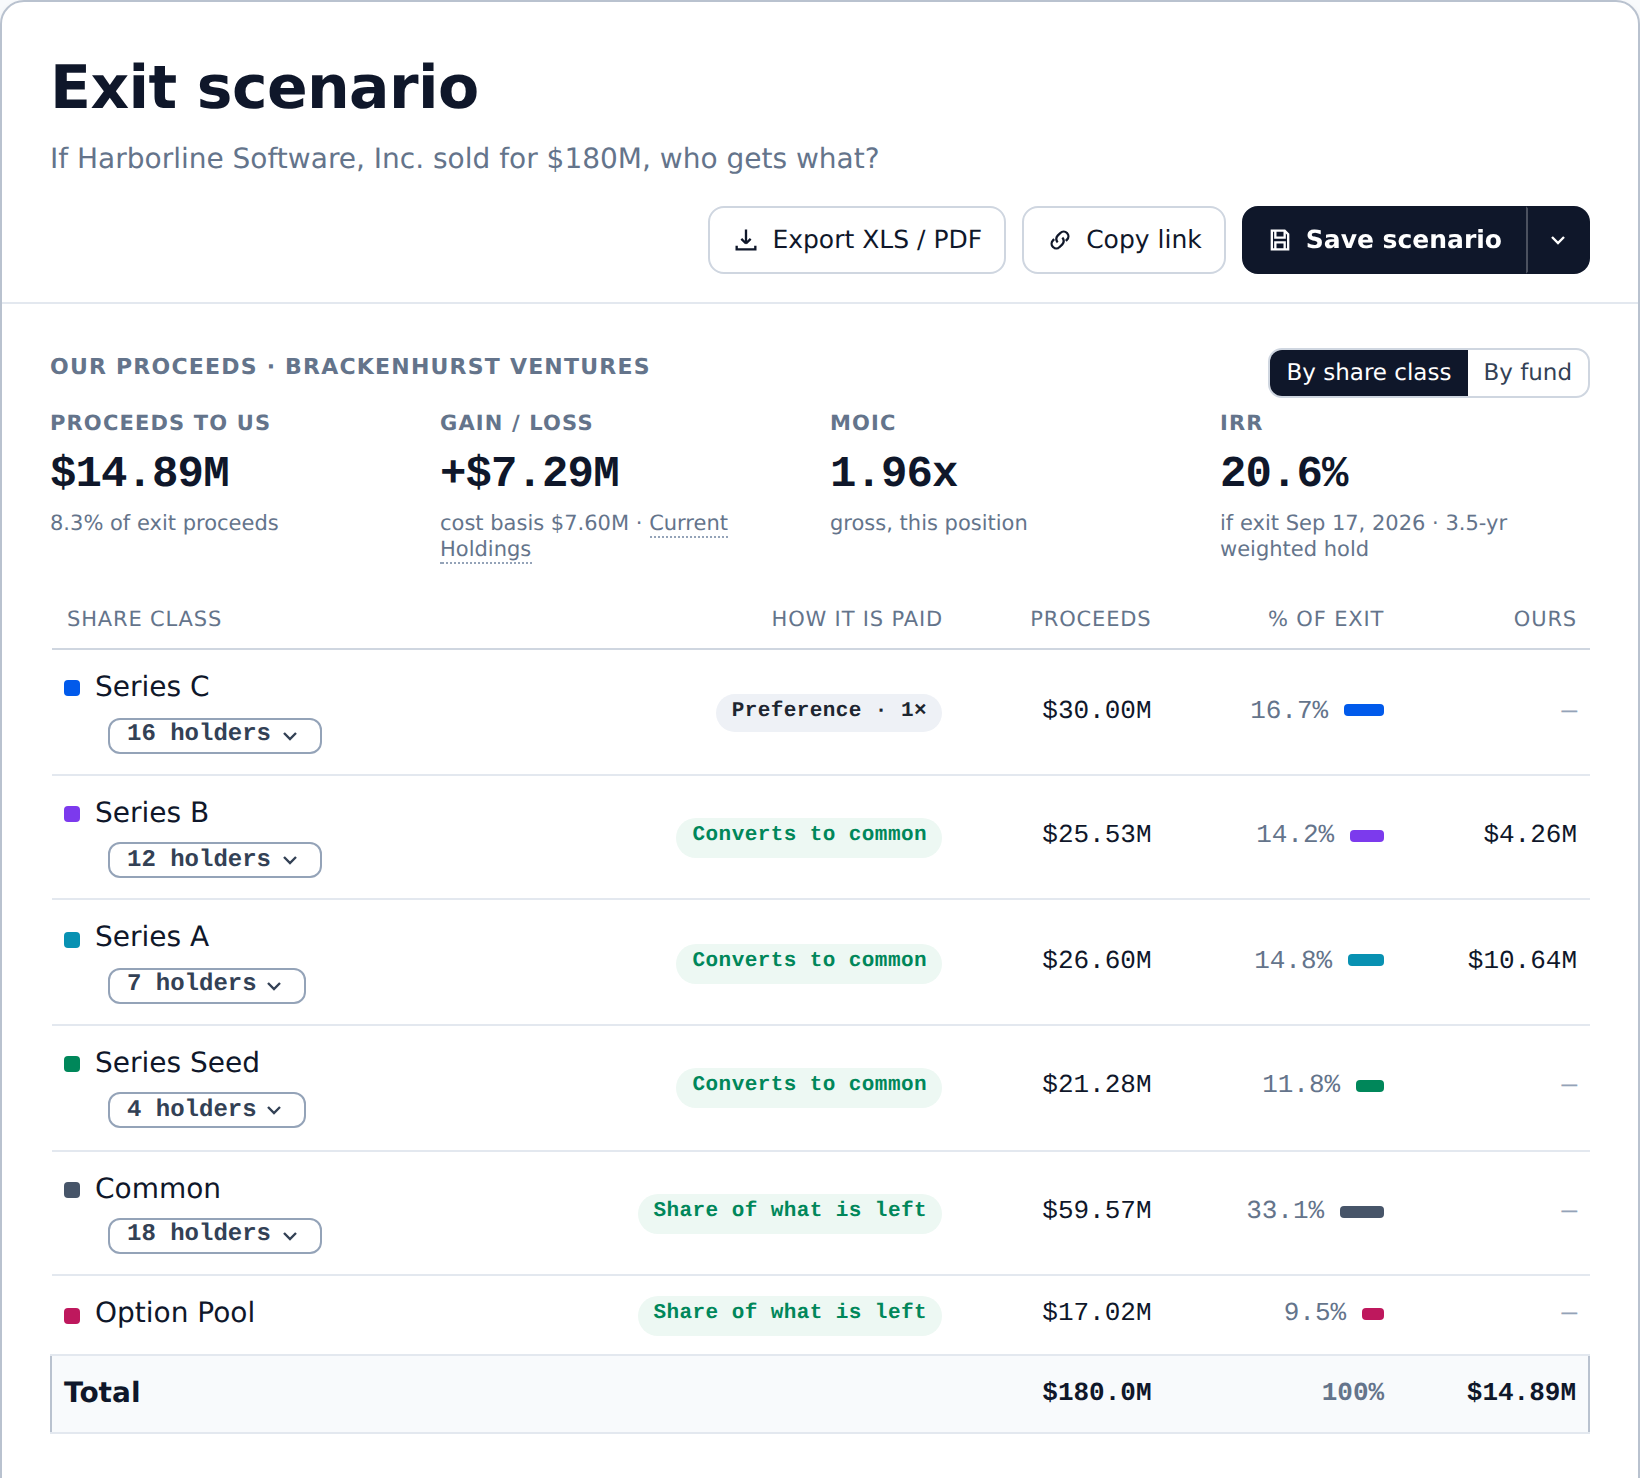
Every term that drives a waterfall sits in documents executed across years of financings. The arithmetic is simple once you have the terms; digging through charters for preferences and dividend rates is what eats the afternoon. Connect GoodStream's private capital agentic harness to your document source and we do the rest: it reads, understands, extracts and associates all of it. Rights and preferences for every company, off the legal documents that are the source. Nobody keys anything in.
- Investment agreements
- The charter and every amendment
- The cap table
- Side letters and edge cases
- Governance documents
- Notes and SAFEs
- Debt documents
- Financials
- Board decks
- Company updates
- 30+ other document types
Who gets what, at any price
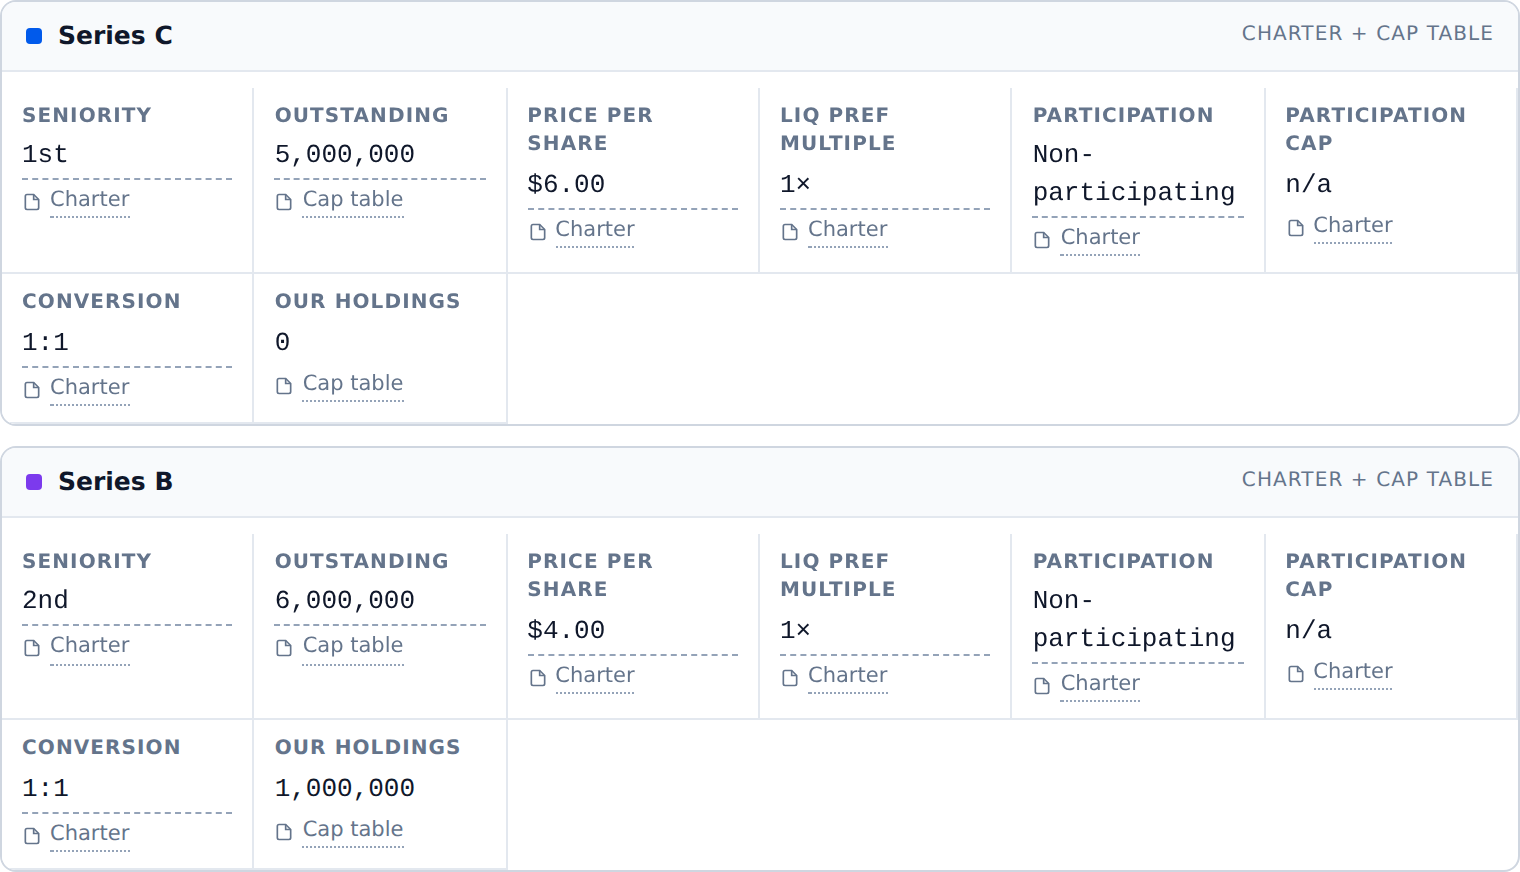
Every shareholder: the fund, the founders, the other investors.
The banker came back with three prices. If you choose option A it looks like this; option B looks like that. The founders want to know what the team clears after the preferred stack. The fund wants to know what comes back, by vehicle. GoodStream answers all of it from one model: proceeds by class, by holder and by fund, MOIC and IRR on your position, the value per share, and every holder of every class one click open.
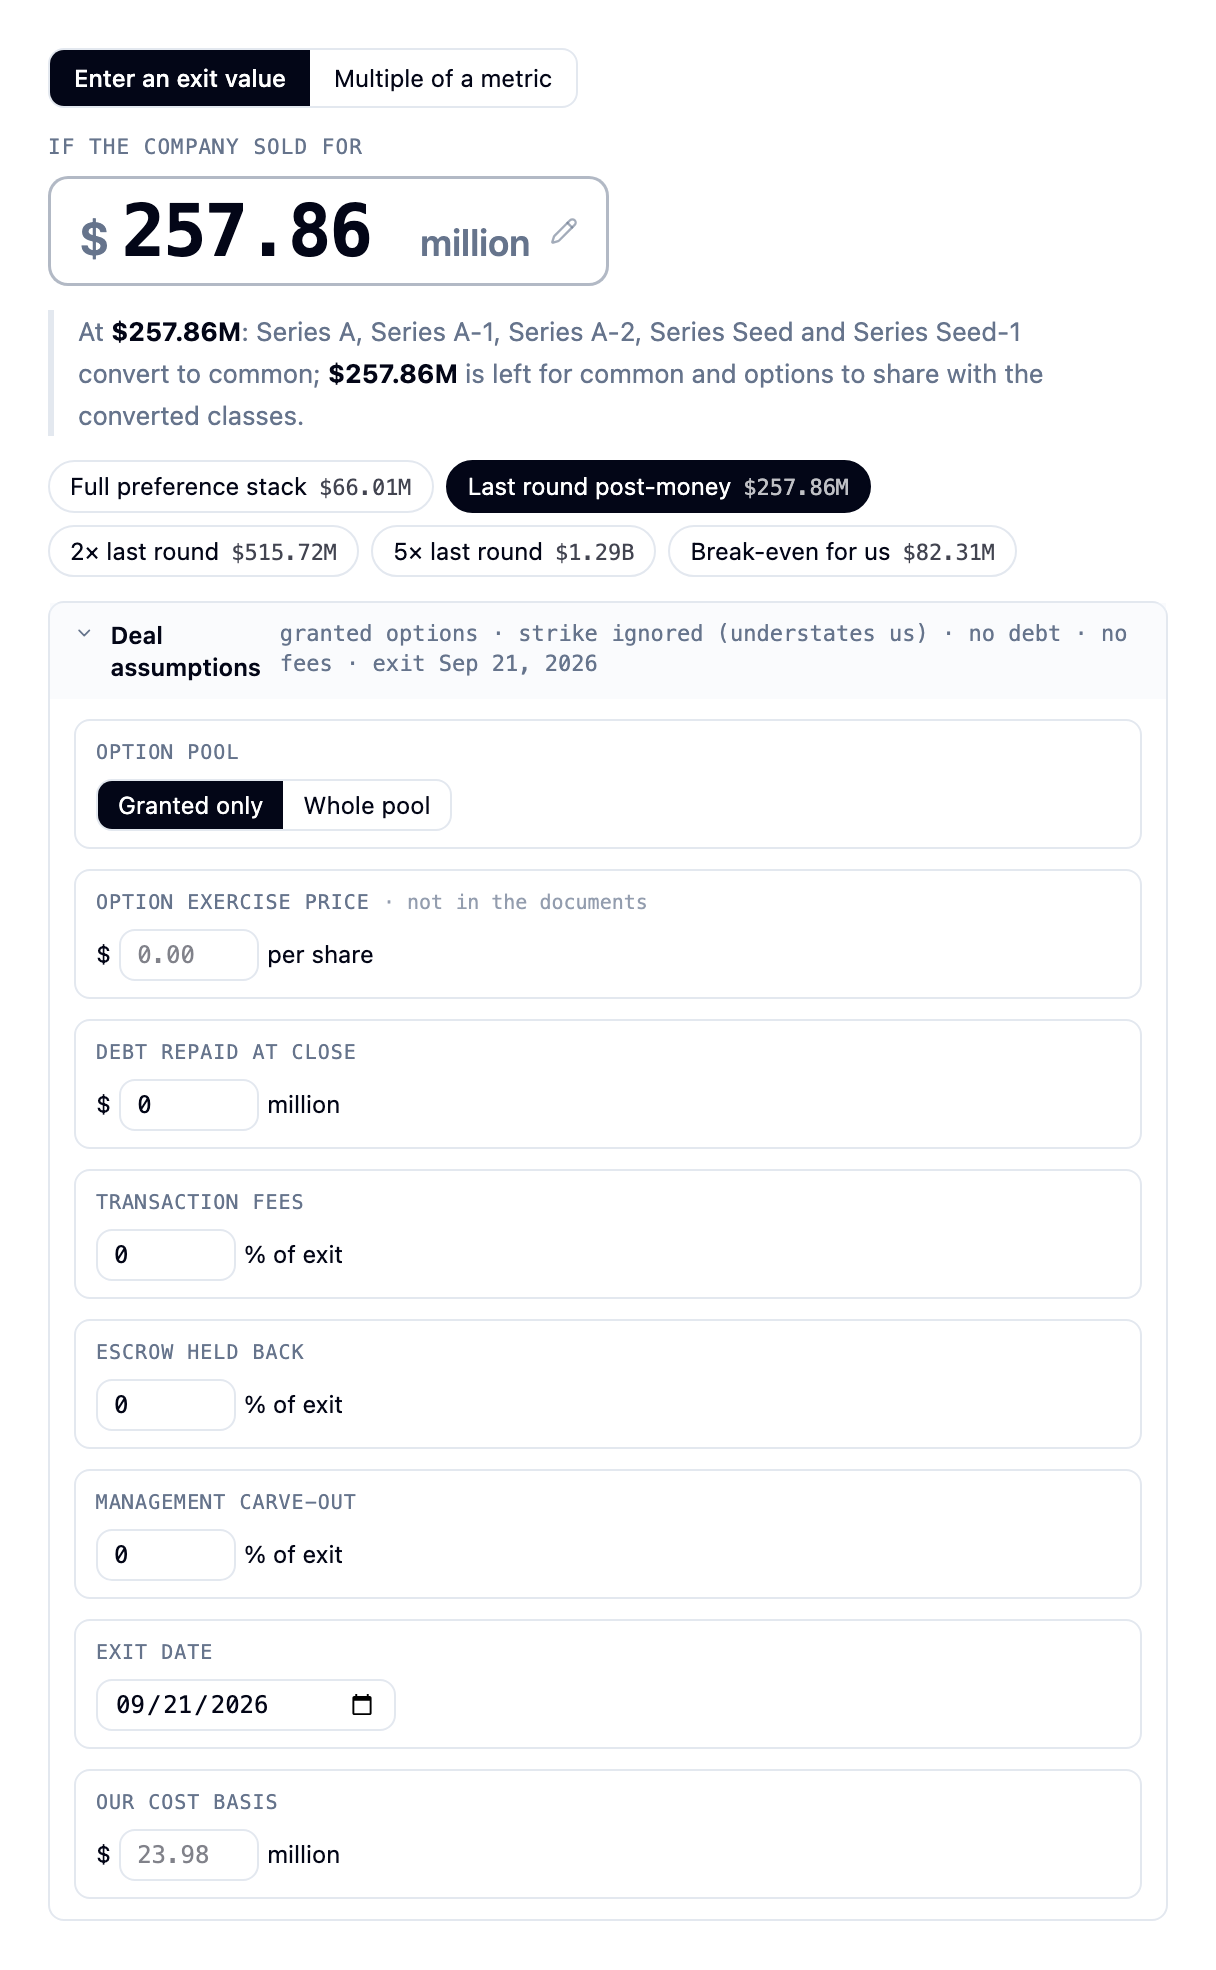
Any price, or a multiple of ARR, EBITDA or the last round, because that's how partners talk.
By fund. Two vehicles in the same company get two answers.
Take it to Excel with the formulas live, not hard-coded numbers, and keep building on it.
Where each class converts
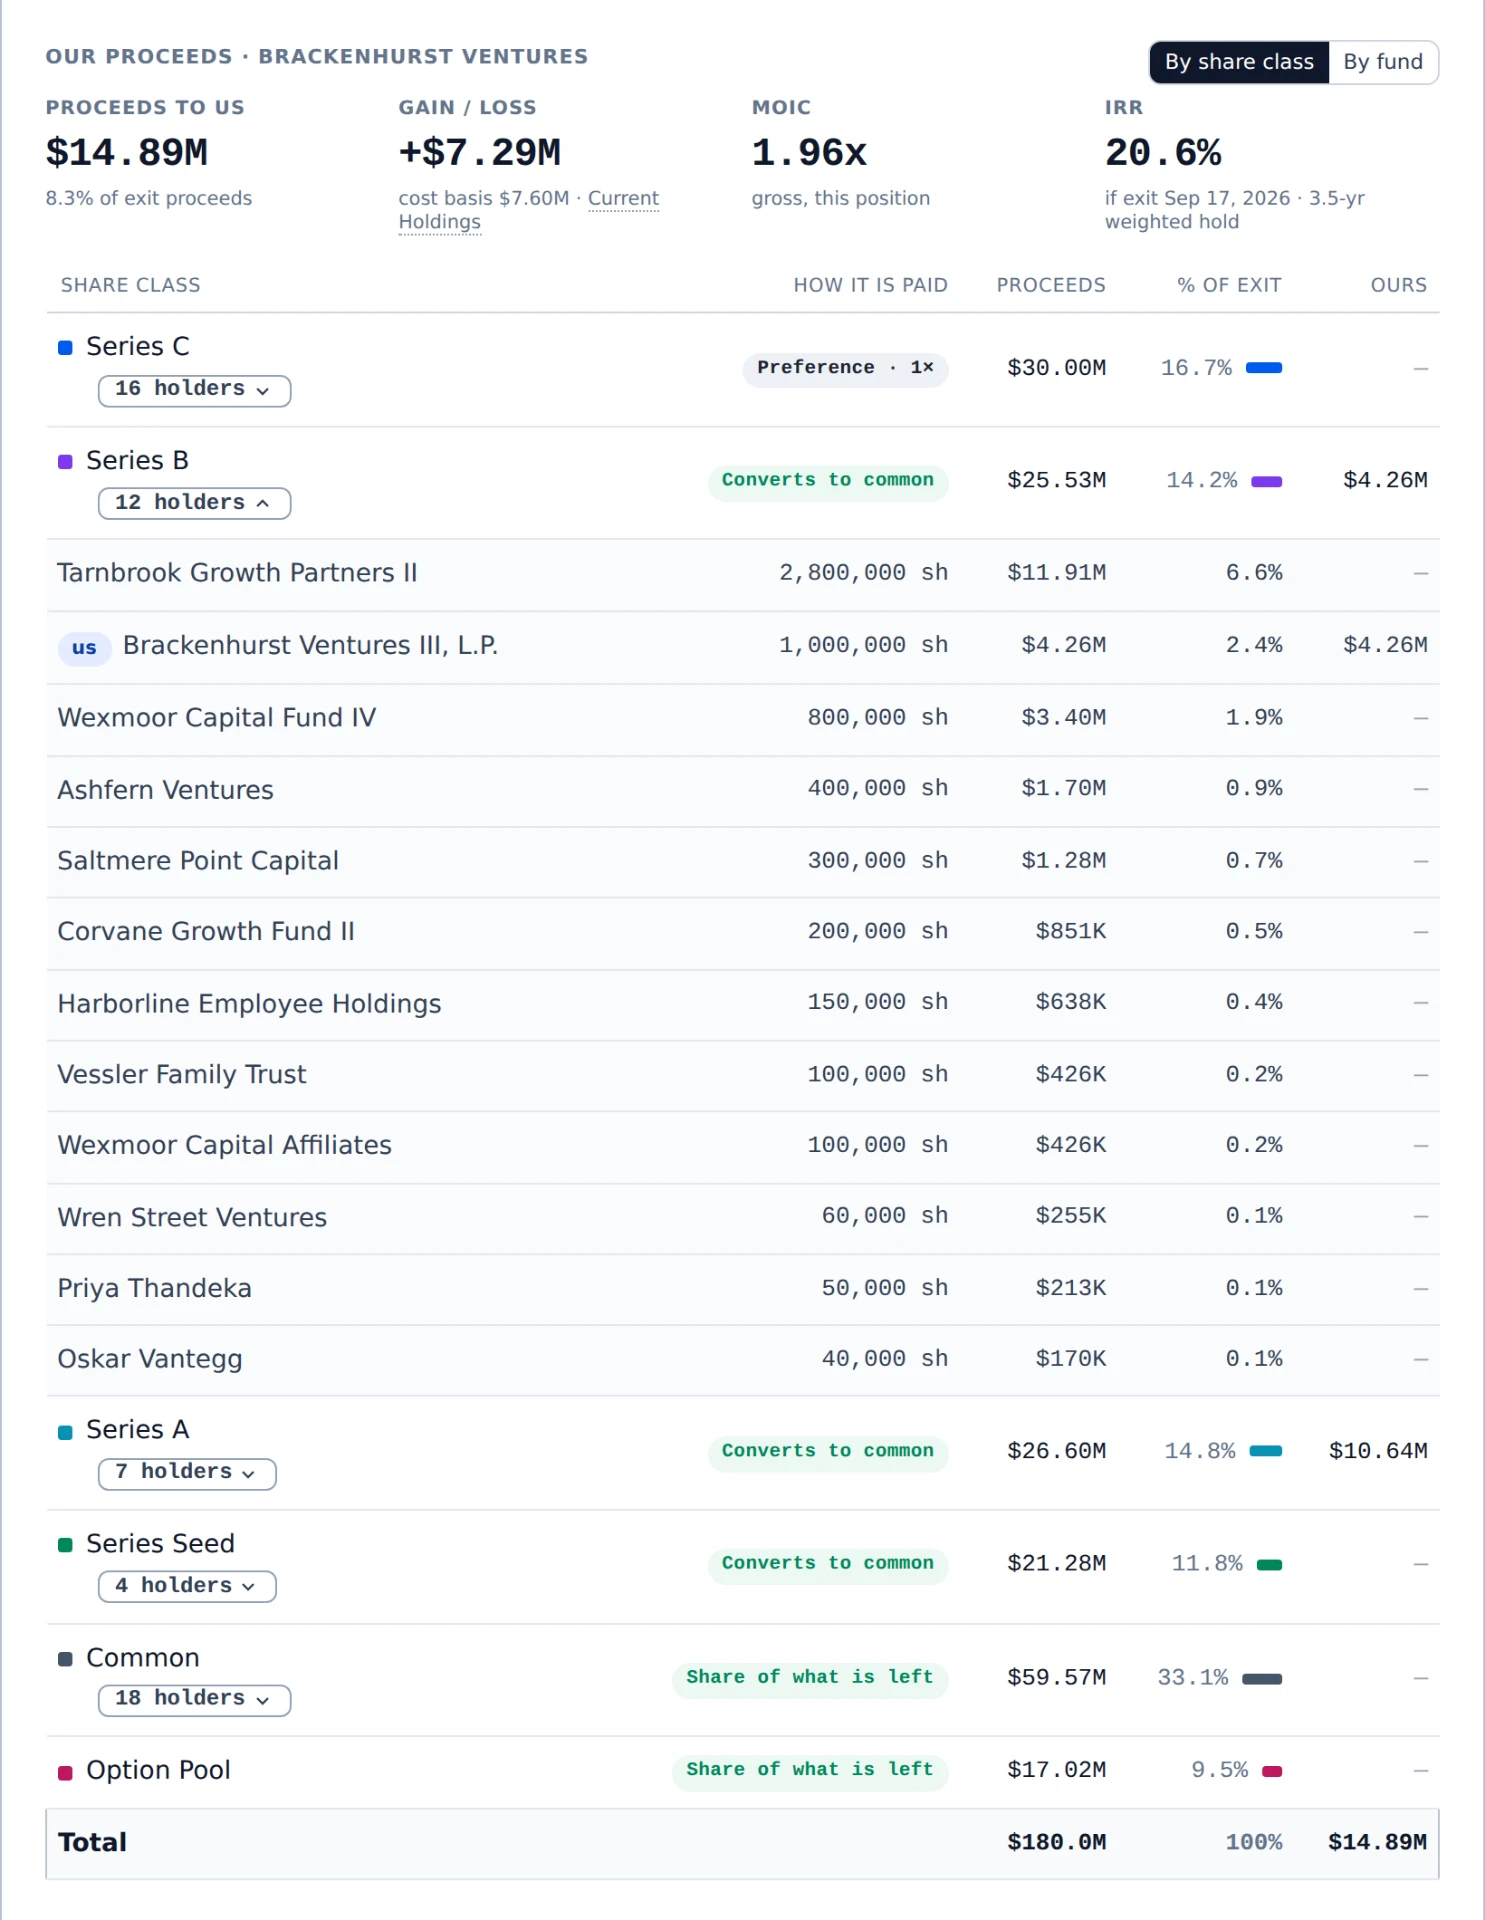
The price where the story changes.
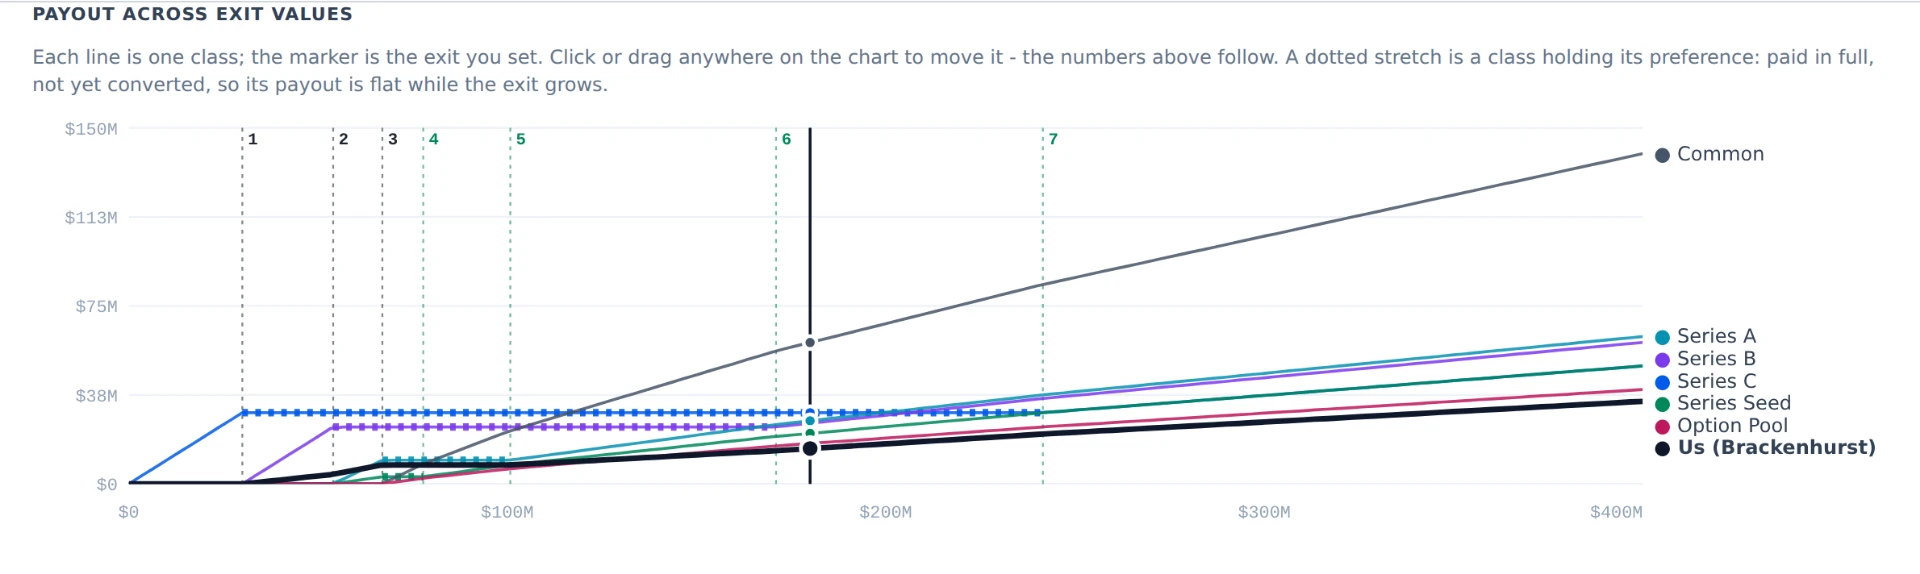
As soon as we clear the preference, everyone converts. No. If you hold Series B on a vanilla cap table, you're not converting until the last round's price, and Series A isn't getting up to that value until then either. Maybe you're returning money; maybe you're only getting your preference back. Every non-participating class has a price where the story changes, and GoodStream shows each of those lines in order, so you know whether the banker's number is above or below the line that matters.
Every number is a receipt
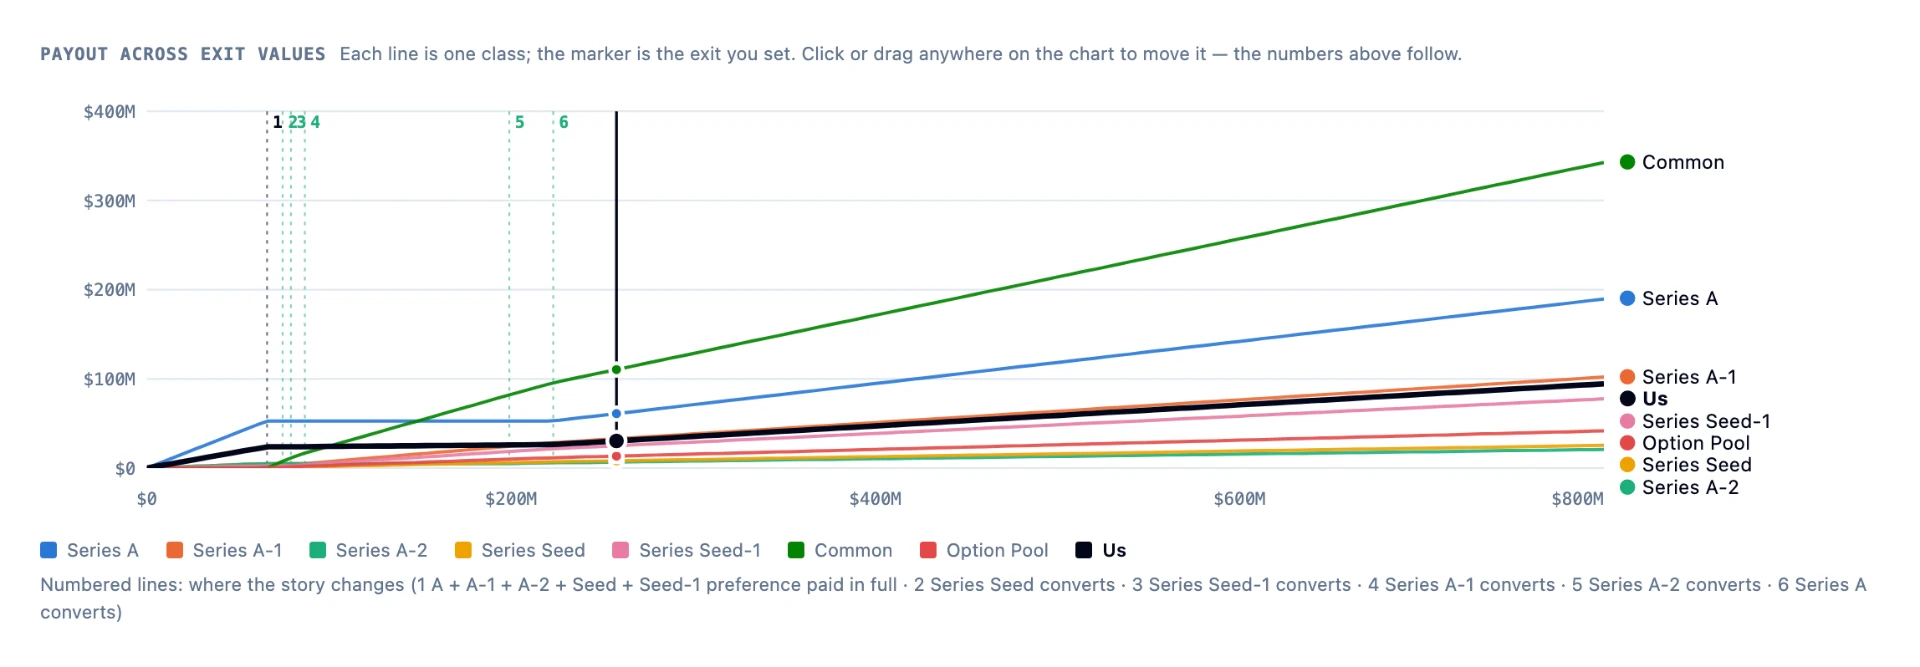
Click any figure and read how it was reached.
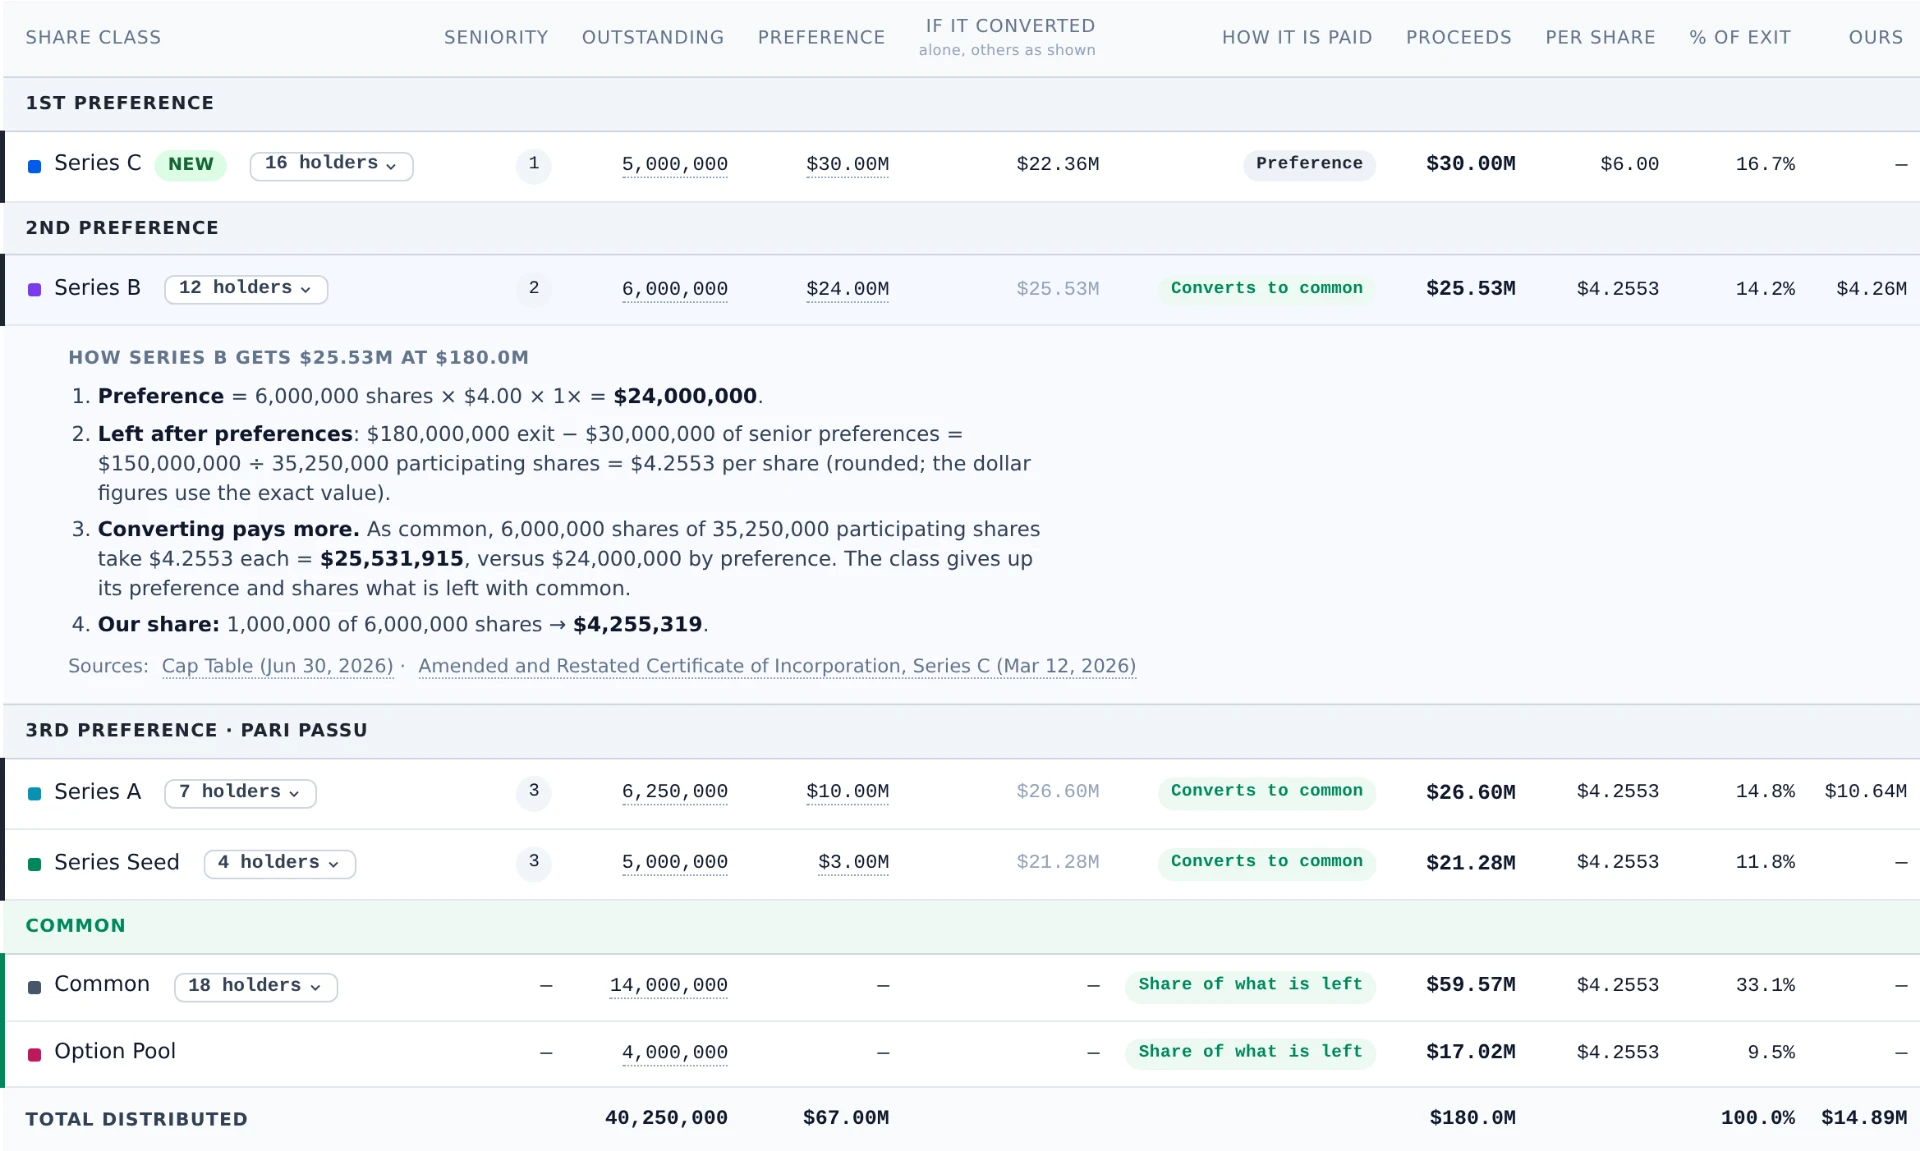
A divided by B gets you a price per share. That's quick and dirty, and it isn't the flow of funds. Every class here opens into the arithmetic behind its number: the preference it is owed, what is left after the senior classes, what it would take as common, and which is more. Every step says where it came from, down to go to page 47 of the charter and you'll see the liquidation preference. It never assumes a term: what the documents don't state is shown as missing, and every assumption the model makes is on the page next to the number.
How much do we get diluted?
The next round, before and after.
Company A is raising a Series B at a $50 million post. We're putting in $2 million. Where does that leave our ownership after the round, and what does the same exit look like the morning after? Enter the round the way you enter an exit: the post-money, the size, your check. The classes, the preferences and the option pool are already in the model off the charter and the cap table, so the round runs on top of them: your ownership after, your place in the new stack, and the exit before and after, side by side. Try a million and try five million. It works the same way for a down round, and for the notes and SAFEs that convert into it. We are the Series B and the new round is at half our price: what is our ownership after, and what does our anti-dilution clause do for us? The charter's clause is read and shown with the conversion ratio in force, and when the cap table's as-converted count and the charter disagree, the difference is flagged with its dollar effect, never silently applied. When the round closes, the new charter and cap table land and the scenario becomes the record.
The hairy cases
Some of them get really tricky. Those are the ones that matter.
A million dollars of debt sounds like you're next in line, until the 3x change-of-control premium means clearing $3 million before the preferences even matter. A 3x liquidation preference nobody flagged. Warrants and a second debt structure that showed up when the company started to struggle. These are the cases the spreadsheet gets wrong, and the ones a waterfall has to get right.
- Debt and change-of-control premiumsOff the top, flagged until the payoff is confirmed.
- Multiples, participation and capsA 3x preference is flagged, not stumbled upon.
- Seniority tiersPaid in the order the charter sets.
- Notes and SAFEsBy their own terms: cap, discount, what they convert into, what they get if the company sells first.
- Fees, escrow, carve-out, option poolOn the page and applied to every number.
- A term the documents don't stateShown as missing. Never guessed.
Bring the pay-to-play round that just closed. We'll run it from the documents, on the call.
Save it, send it, take it to Excel
The same numbers at year-end.
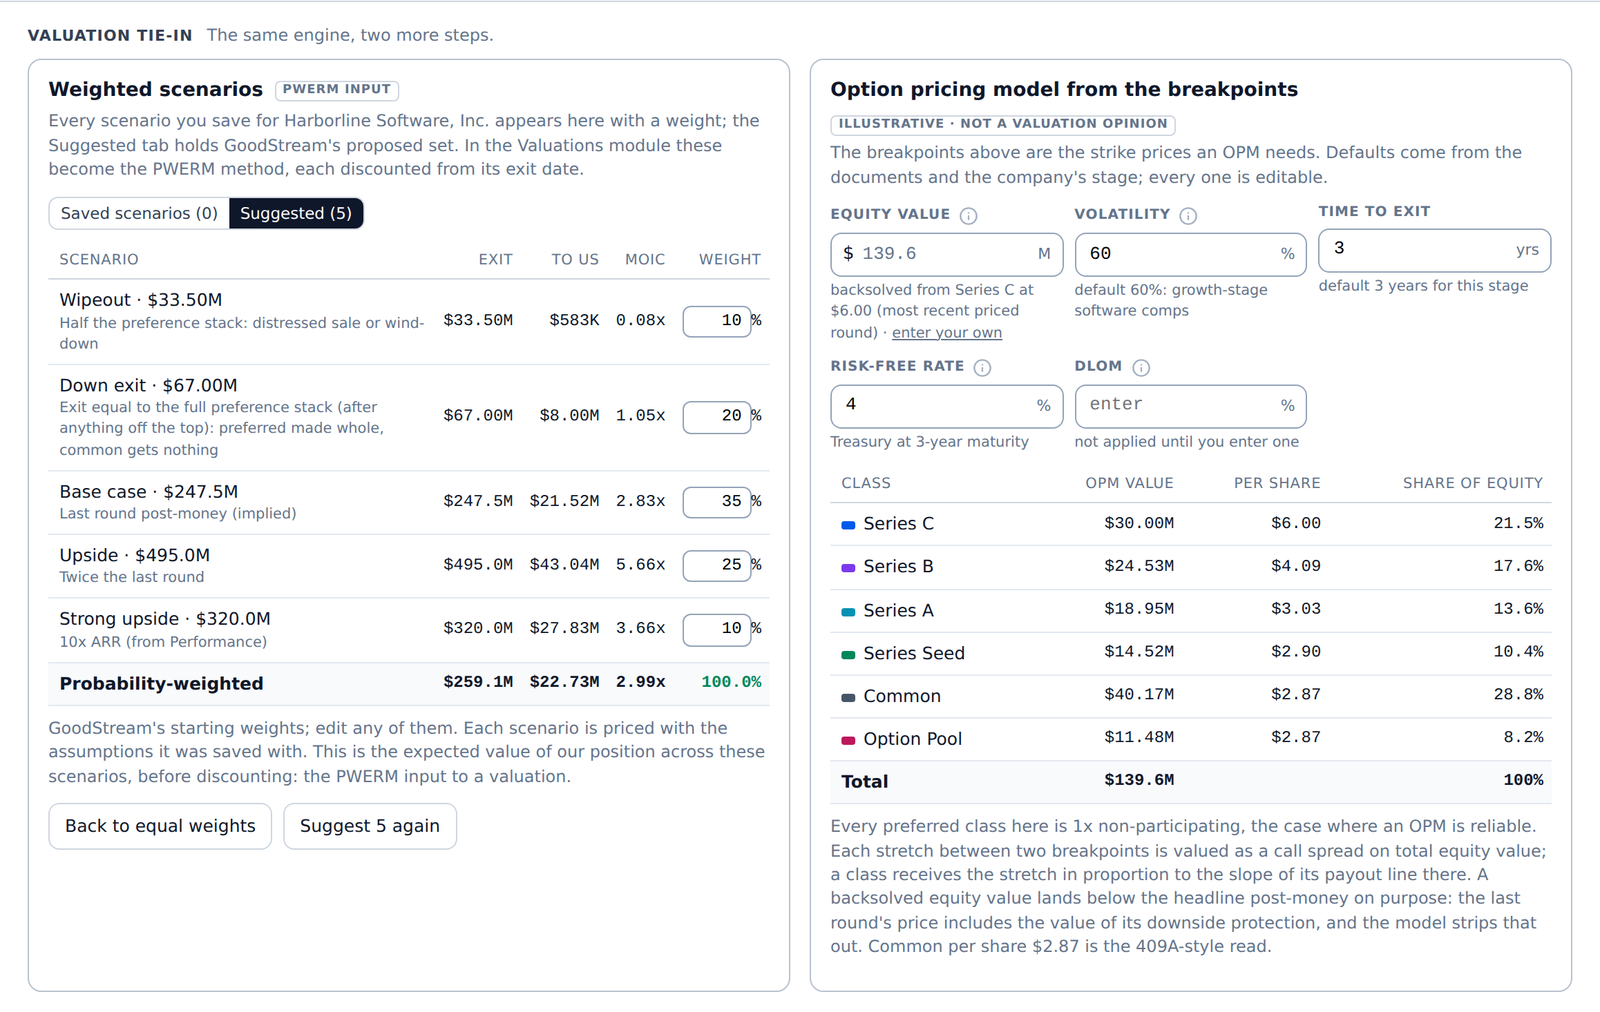
A saved scenario freezes the documents it was computed from, so a number you already sent to someone doesn't move when a new document arrives. A link sends the answer instead of a spreadsheet. Excel export keeps the formulas live, so you can keep building on it: the calculations, not hard-coded numbers. And at year-end, the same breakpoints your partners used all year feed the valuation.
See your own exit scenarios, on your own portfolio companies.
Pick any company you hold. We'll build its waterfall from your documents and walk through it with you on the call, before you wire us a dollar. Partners can run it themselves, and book this themselves, without finance in the room: thirty minutes, one of your companies. Someone at the fund connects the inbox and the drive once; after that no partner touches setup.
"This is the number one request from a deal team member right now."